AIAG & VDA FMEA
Syside Derisker performs safety and reliability analysis according to the AIAG & VDA FMEA Handbook.
Parse and Analyze Failure Modes
Derisker extracts failure modes from your SysML v2 model and automatically computes inherited values like severity, occurrence and detection ratings and uses them to compute the criticality rating. This eliminates manual calculations and ensures consistency across your analysis.
How to Parse
Open Derisker panel (click in left sidebar)
Enter the top level package name of your FMEA model, e.g.
Derisker_AIAG_ExampleFMEAClick Parse AIAG & VDA FMEA
The parser automatically checks for any missing or incomplete elements of the FMEA analysis and displays the failure modes in editable table views.
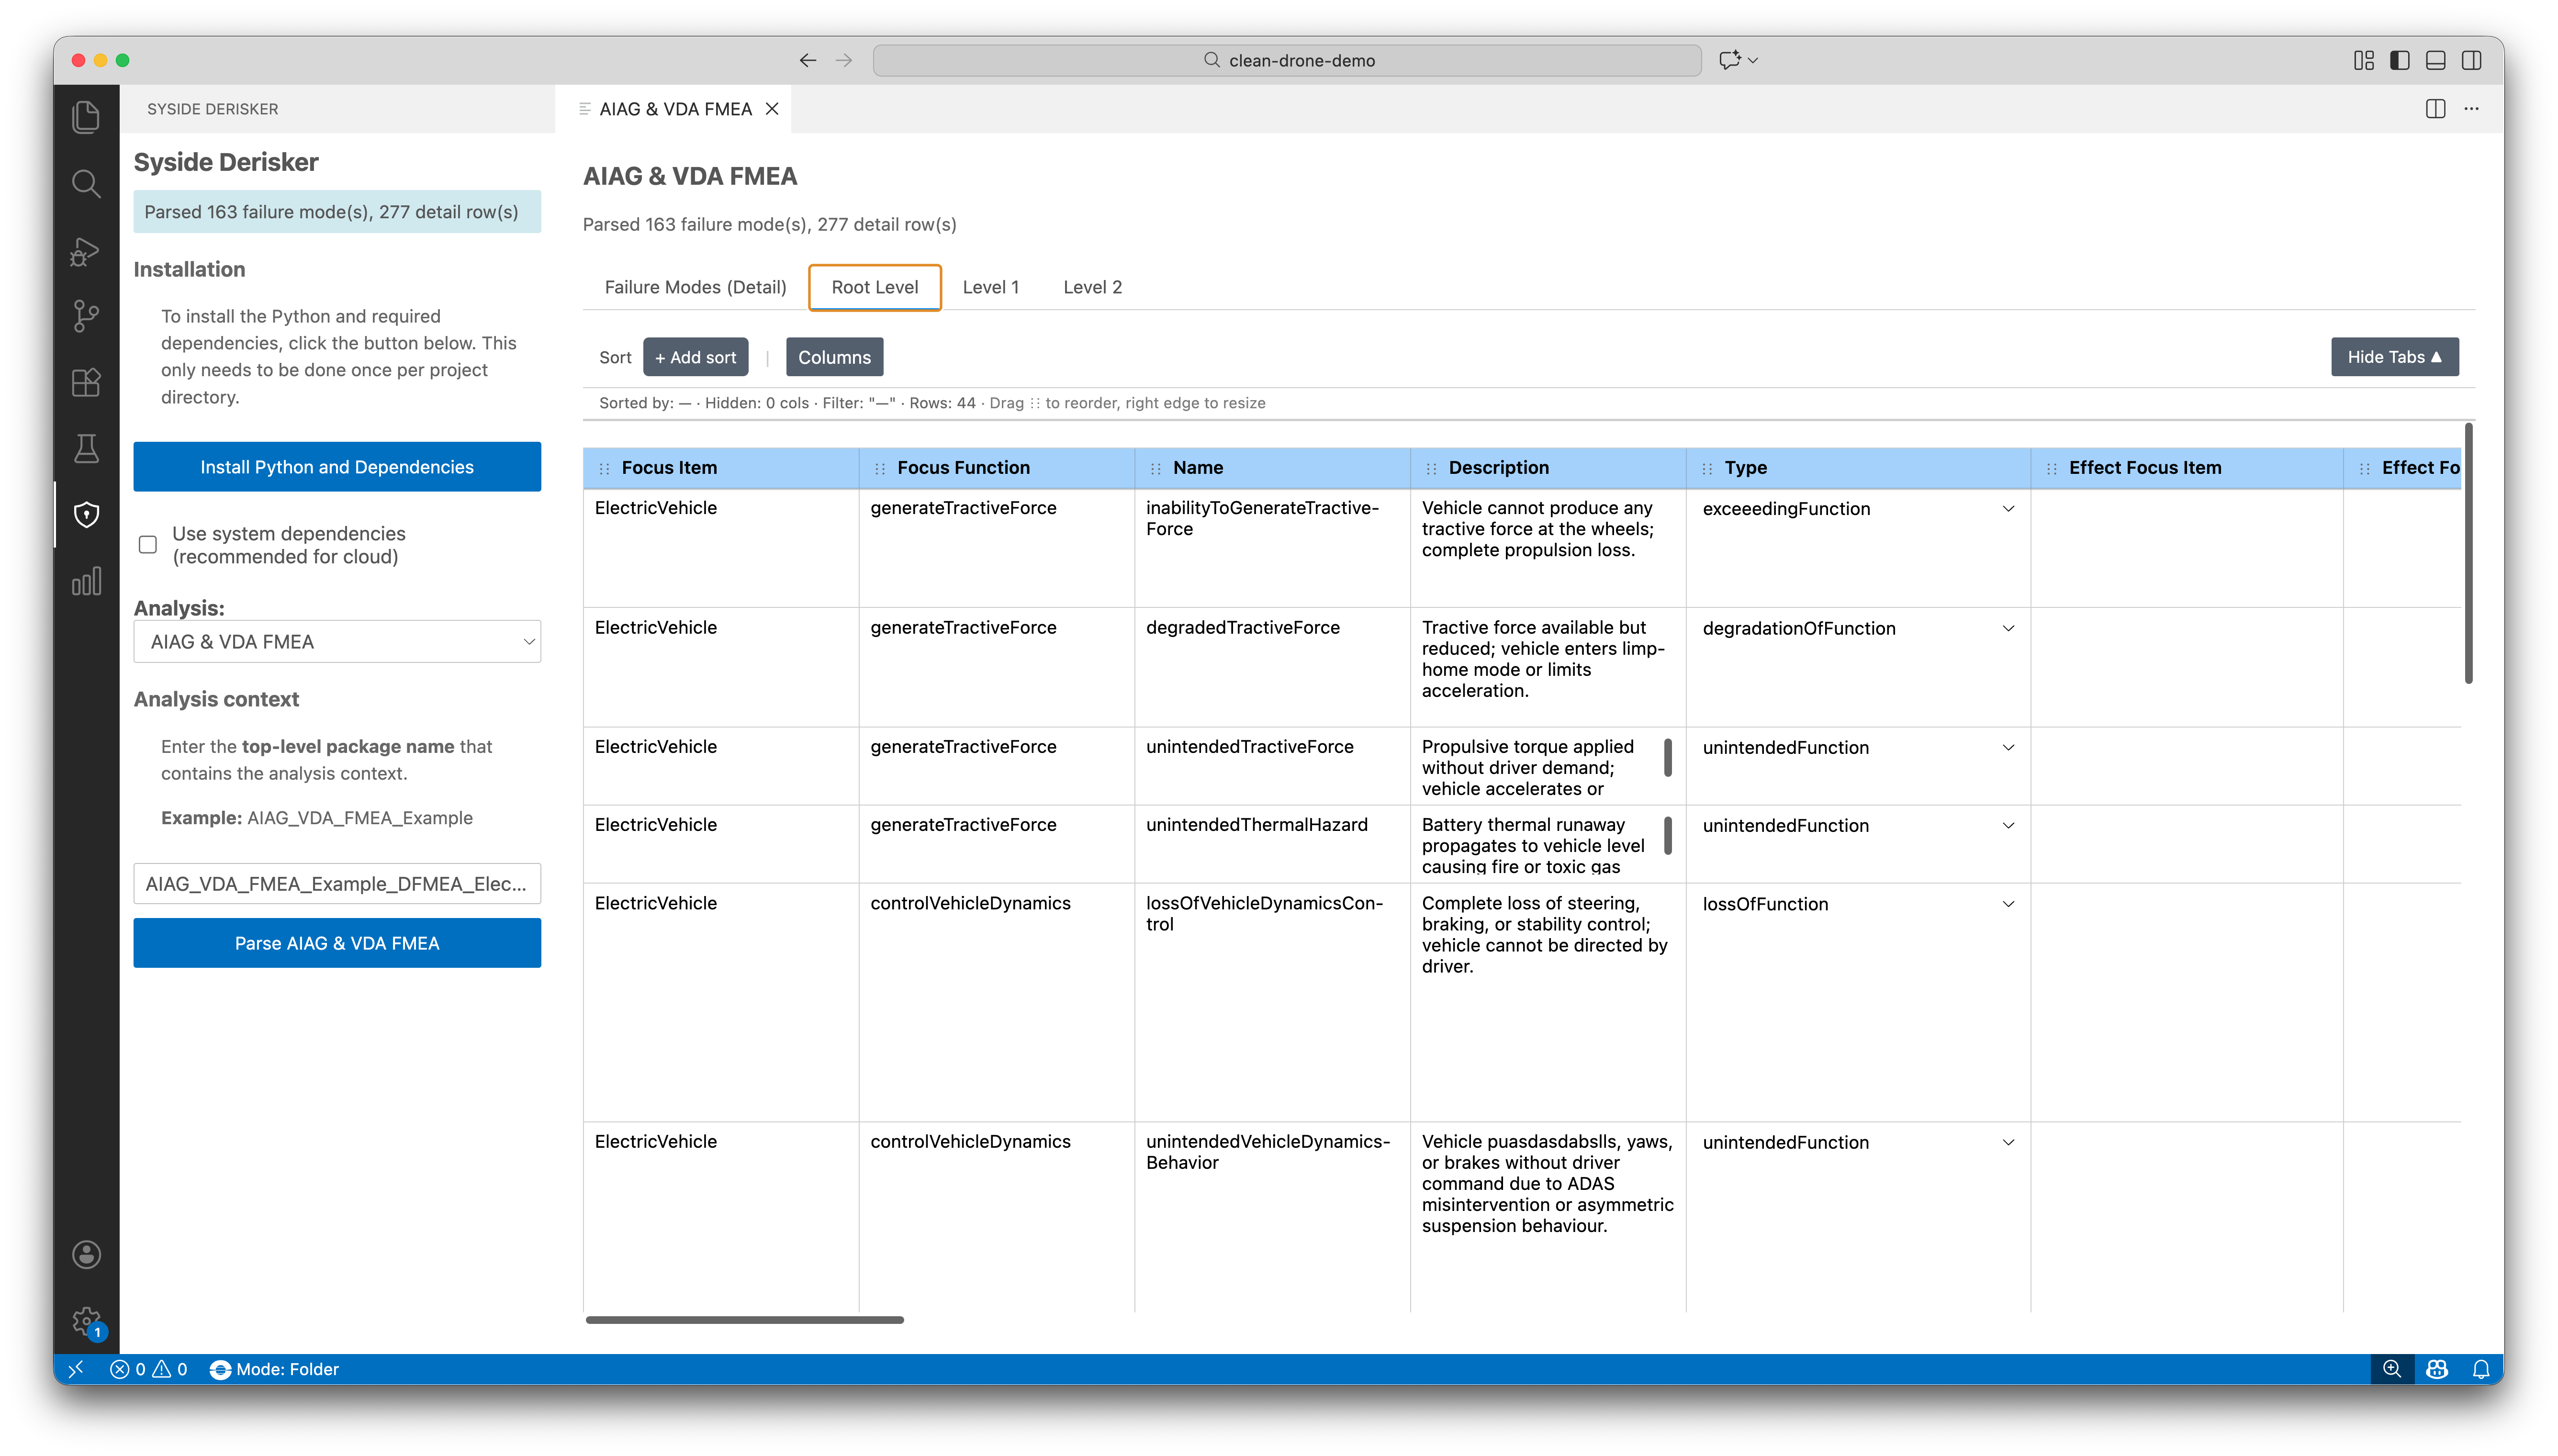
Resulting Table Views
After a successful parse, the data is displayed in a table according to the AIAG & VDA FMEA Handbook format, each row representing a failure mode. There are also tables for viewing failure modes of a specific architectural level.
Automatic Computations
Derisker computes derived values automatically:
Severity |
Propagates top-down from effects (higher-severity effects flow to their causes) |
Occurrence |
Propagates bottom-up from causes (higher probabilities flow upward to effects) |
Detectability |
Propagates bottom-up from causes (higher detectability ratings flow upward to effects) |
Action Priority |
Computed using relevant formulas for each analysis type, as specified in the AIAG & VDA FMEA Handbook |
Work with Table View
Review and edit failure mode data in an interactive table with bidirectional synchronization to your SysML model.
Table Features
View and organize: Customize columns, sort by any field, select rows for navigation
Color map: Attributes with associated values have a color map applied to them to help visualize the values
Edit properties: Editable cells automatically save changes to the SysML model
Navigate to source: Click
Go to Sourcein the right-click context menu to jump to the definition of the element in your SysML fileVisualize Failure Chains: Click
Visualize Failure Chainin the right-click context menu to visualize the failure chain for a specific failure mode
Note
Not all the attributes are editable. Some columns represent information that is implicit rather than explicit; those fields are not editable directly.
Visualize Failure Chains
Understand how failures propagate through your system with interactive graph visualizations showing cause-effect relationships for any failure mode.
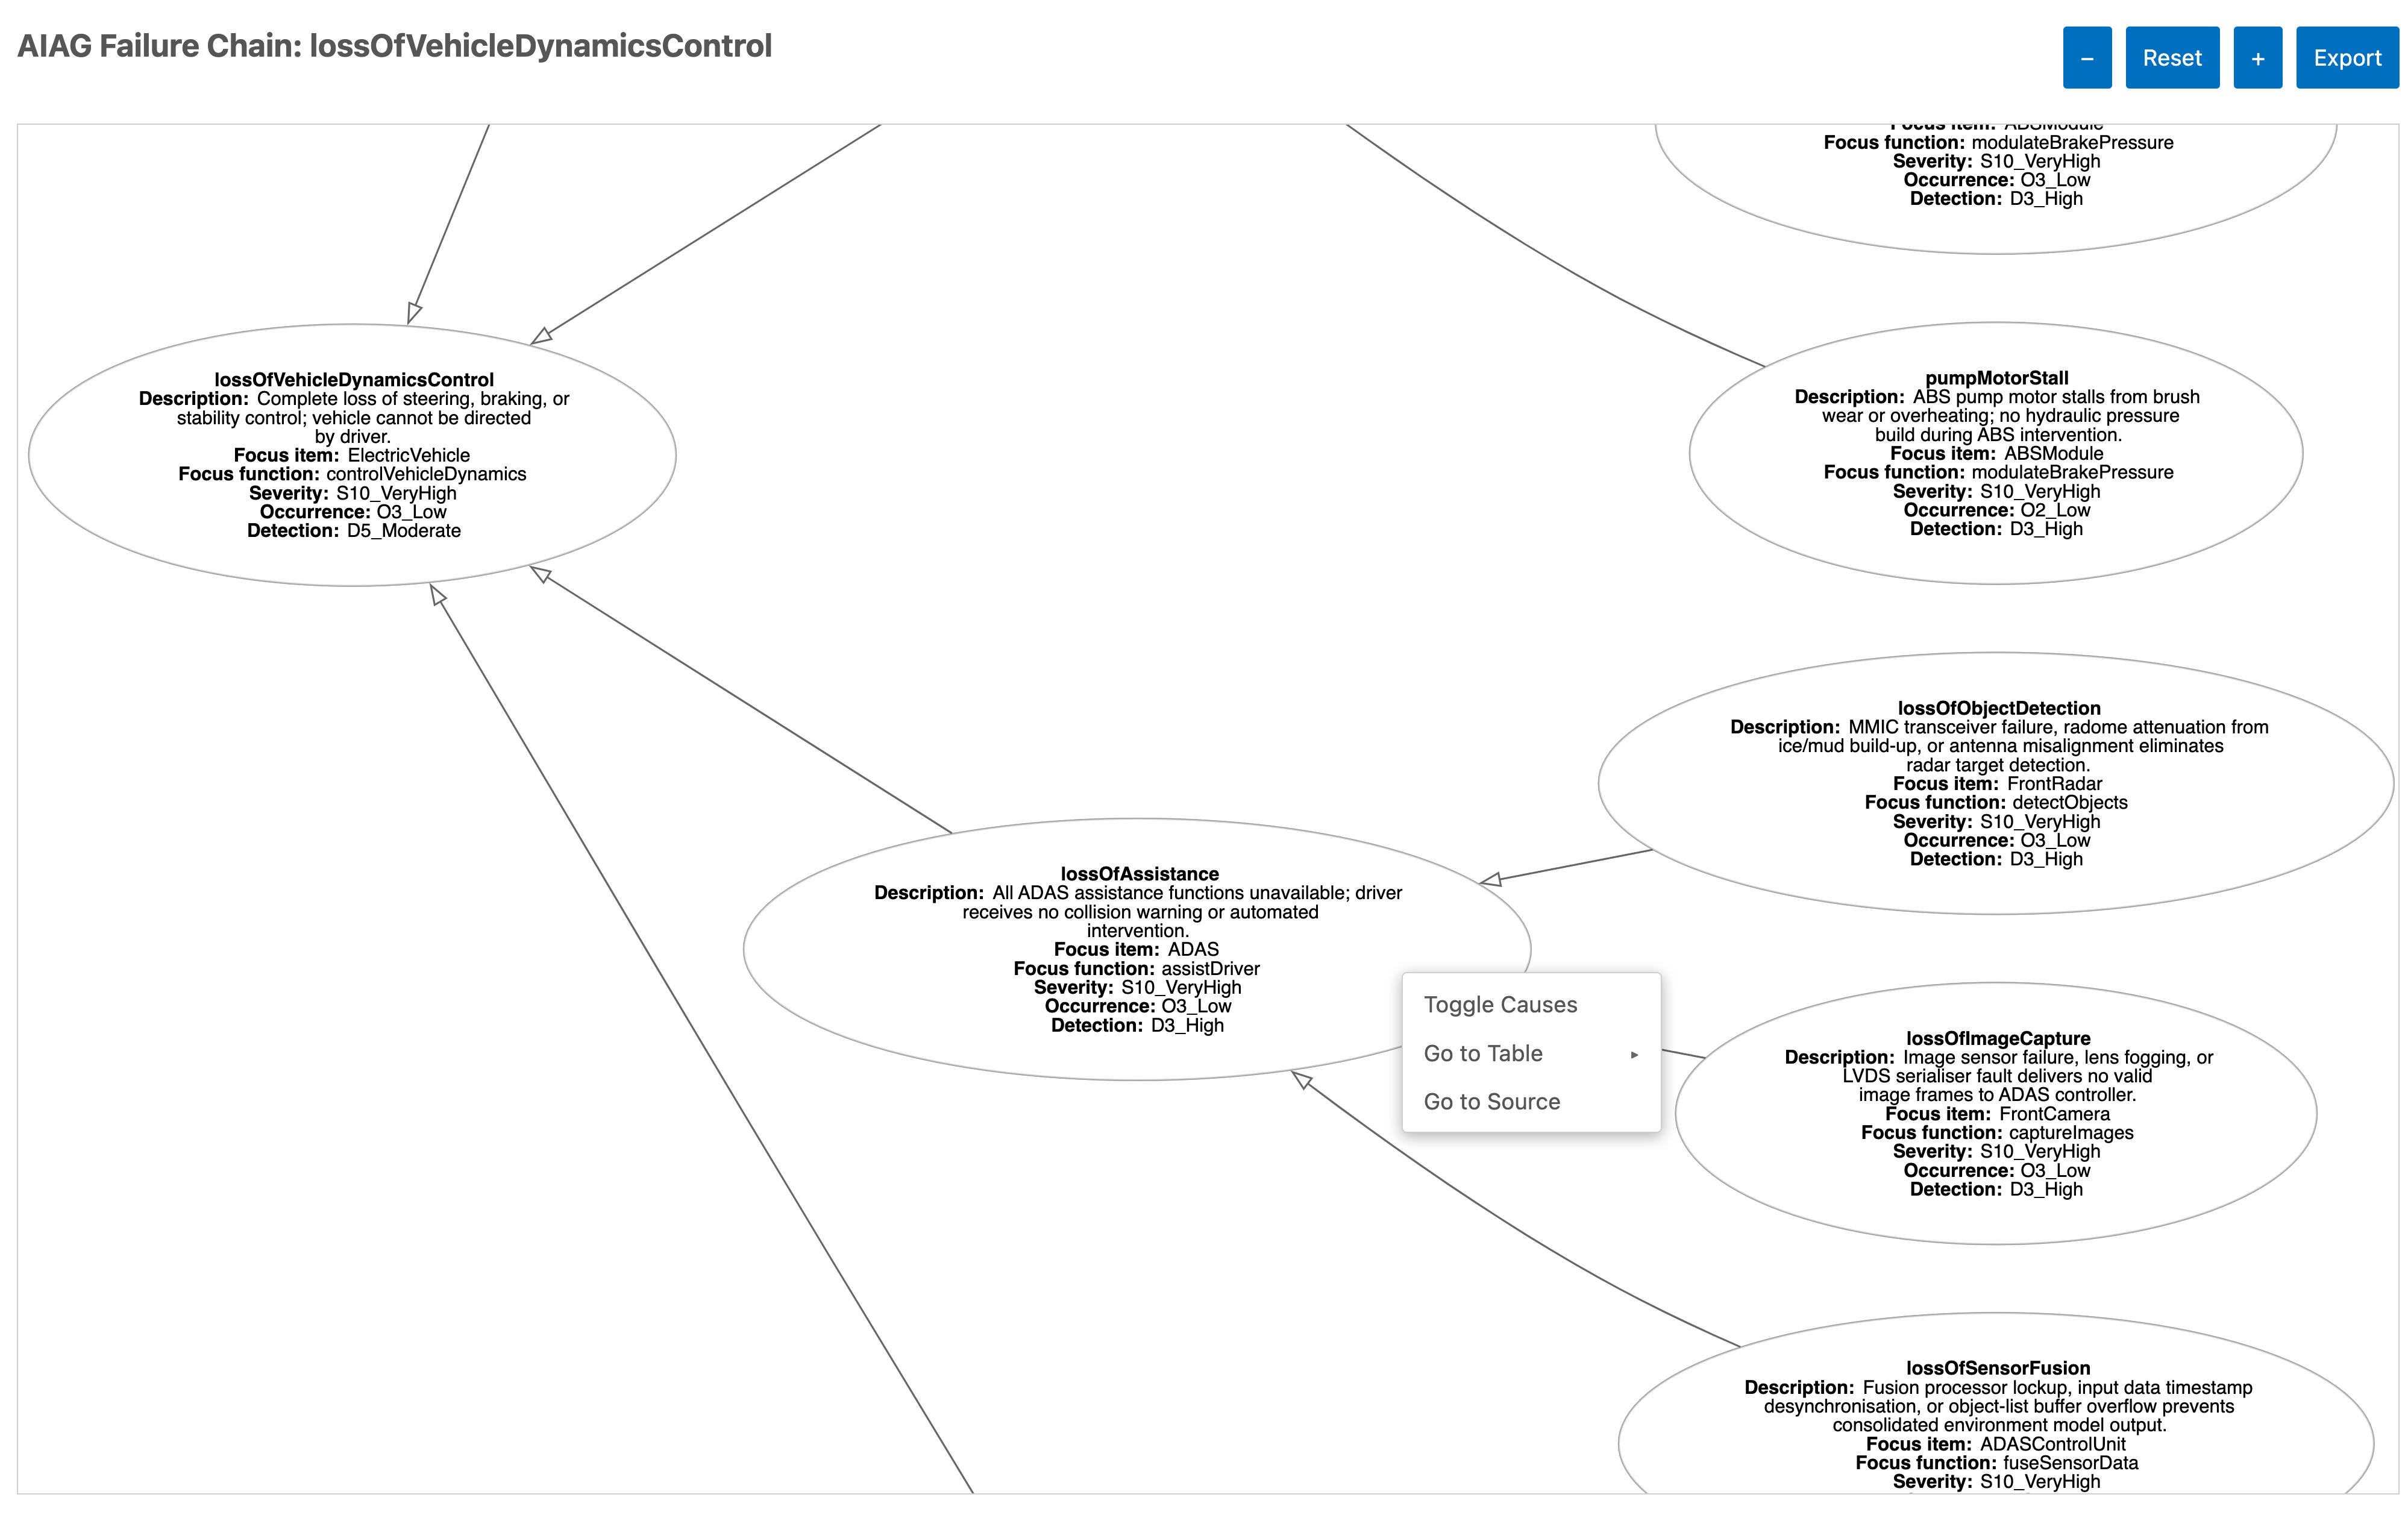
How to Visualize
In table view, select a failure mode row
Click
Visualize Failure Chainfrom the right-click context menuGraph opens in new panel showing the failure mode and its relationships
Interact with the graph:
Navigate: Pan (click and drag), zoom (+/- buttons), reset view
Explore nodes: Right-click any node to toggle causes, go to source (SysML), or jump to the table view row for the element (FMEA)
Export: Click Export in the top right corner to save the graph as PNG or JPEG
Note
Graphviz must be installed. See Install Graphviz for installation instructions.
Export Results
Share analysis results by exporting visualizations.
How to Export
Export graph to image:
In the failure chain graph view, click Export
Select format (PNG or JPEG) and save location
Image captures current graph layout and zoom level