Features
This section describes Derisker’s features in detail. For a product overview see User Guide.
Supported standards:
ECSS-Q-ST-30-02C — ECSS-Q-ST-30-02C: Design FMEA, Design FMECA, Process FMECA, and Hardware-Software Interaction Analysis (HSIA)
ISO 26262-3 — ISO 26262-3: Hazard Analysis and Risk Assessment (HARA) and Functional Safety Concept
AIAG & VDA FMEA — AIAG & VDA FMEA Handbook: Design FMEA (DFMEA) with Action Priority (AP) calculation
Coming soon:
ISO 26262 other parts (Parts 4–6: System, Hardware, Software design)
ISO/SAE 21434: Road vehicles — Cybersecurity
Parse and validate
By selecting the desired standard and entering the required information, Derisker parses the SysML v2 model, validates it, and displays the results in specialized table views. The parser checks for missing or incomplete elements, detects invalid relationships (such as cycles in failure chains), and automatically computes derived values.
Auto-inherit and auto-calculate risk ratings
Derisker automatically propagates and computes risk ratings across the model hierarchy:
Severity flows top-down from effects to causes
Probability / Occurrence flows bottom-up from root causes to higher-level failures
Detection flows bottom-up from root causes (Process FMECA and AIAG DFMEA)
Criticality numbers (CN, AP) are computed using the formula specified by each standard
You set ratings only at the appropriate level; all other values are derived automatically.
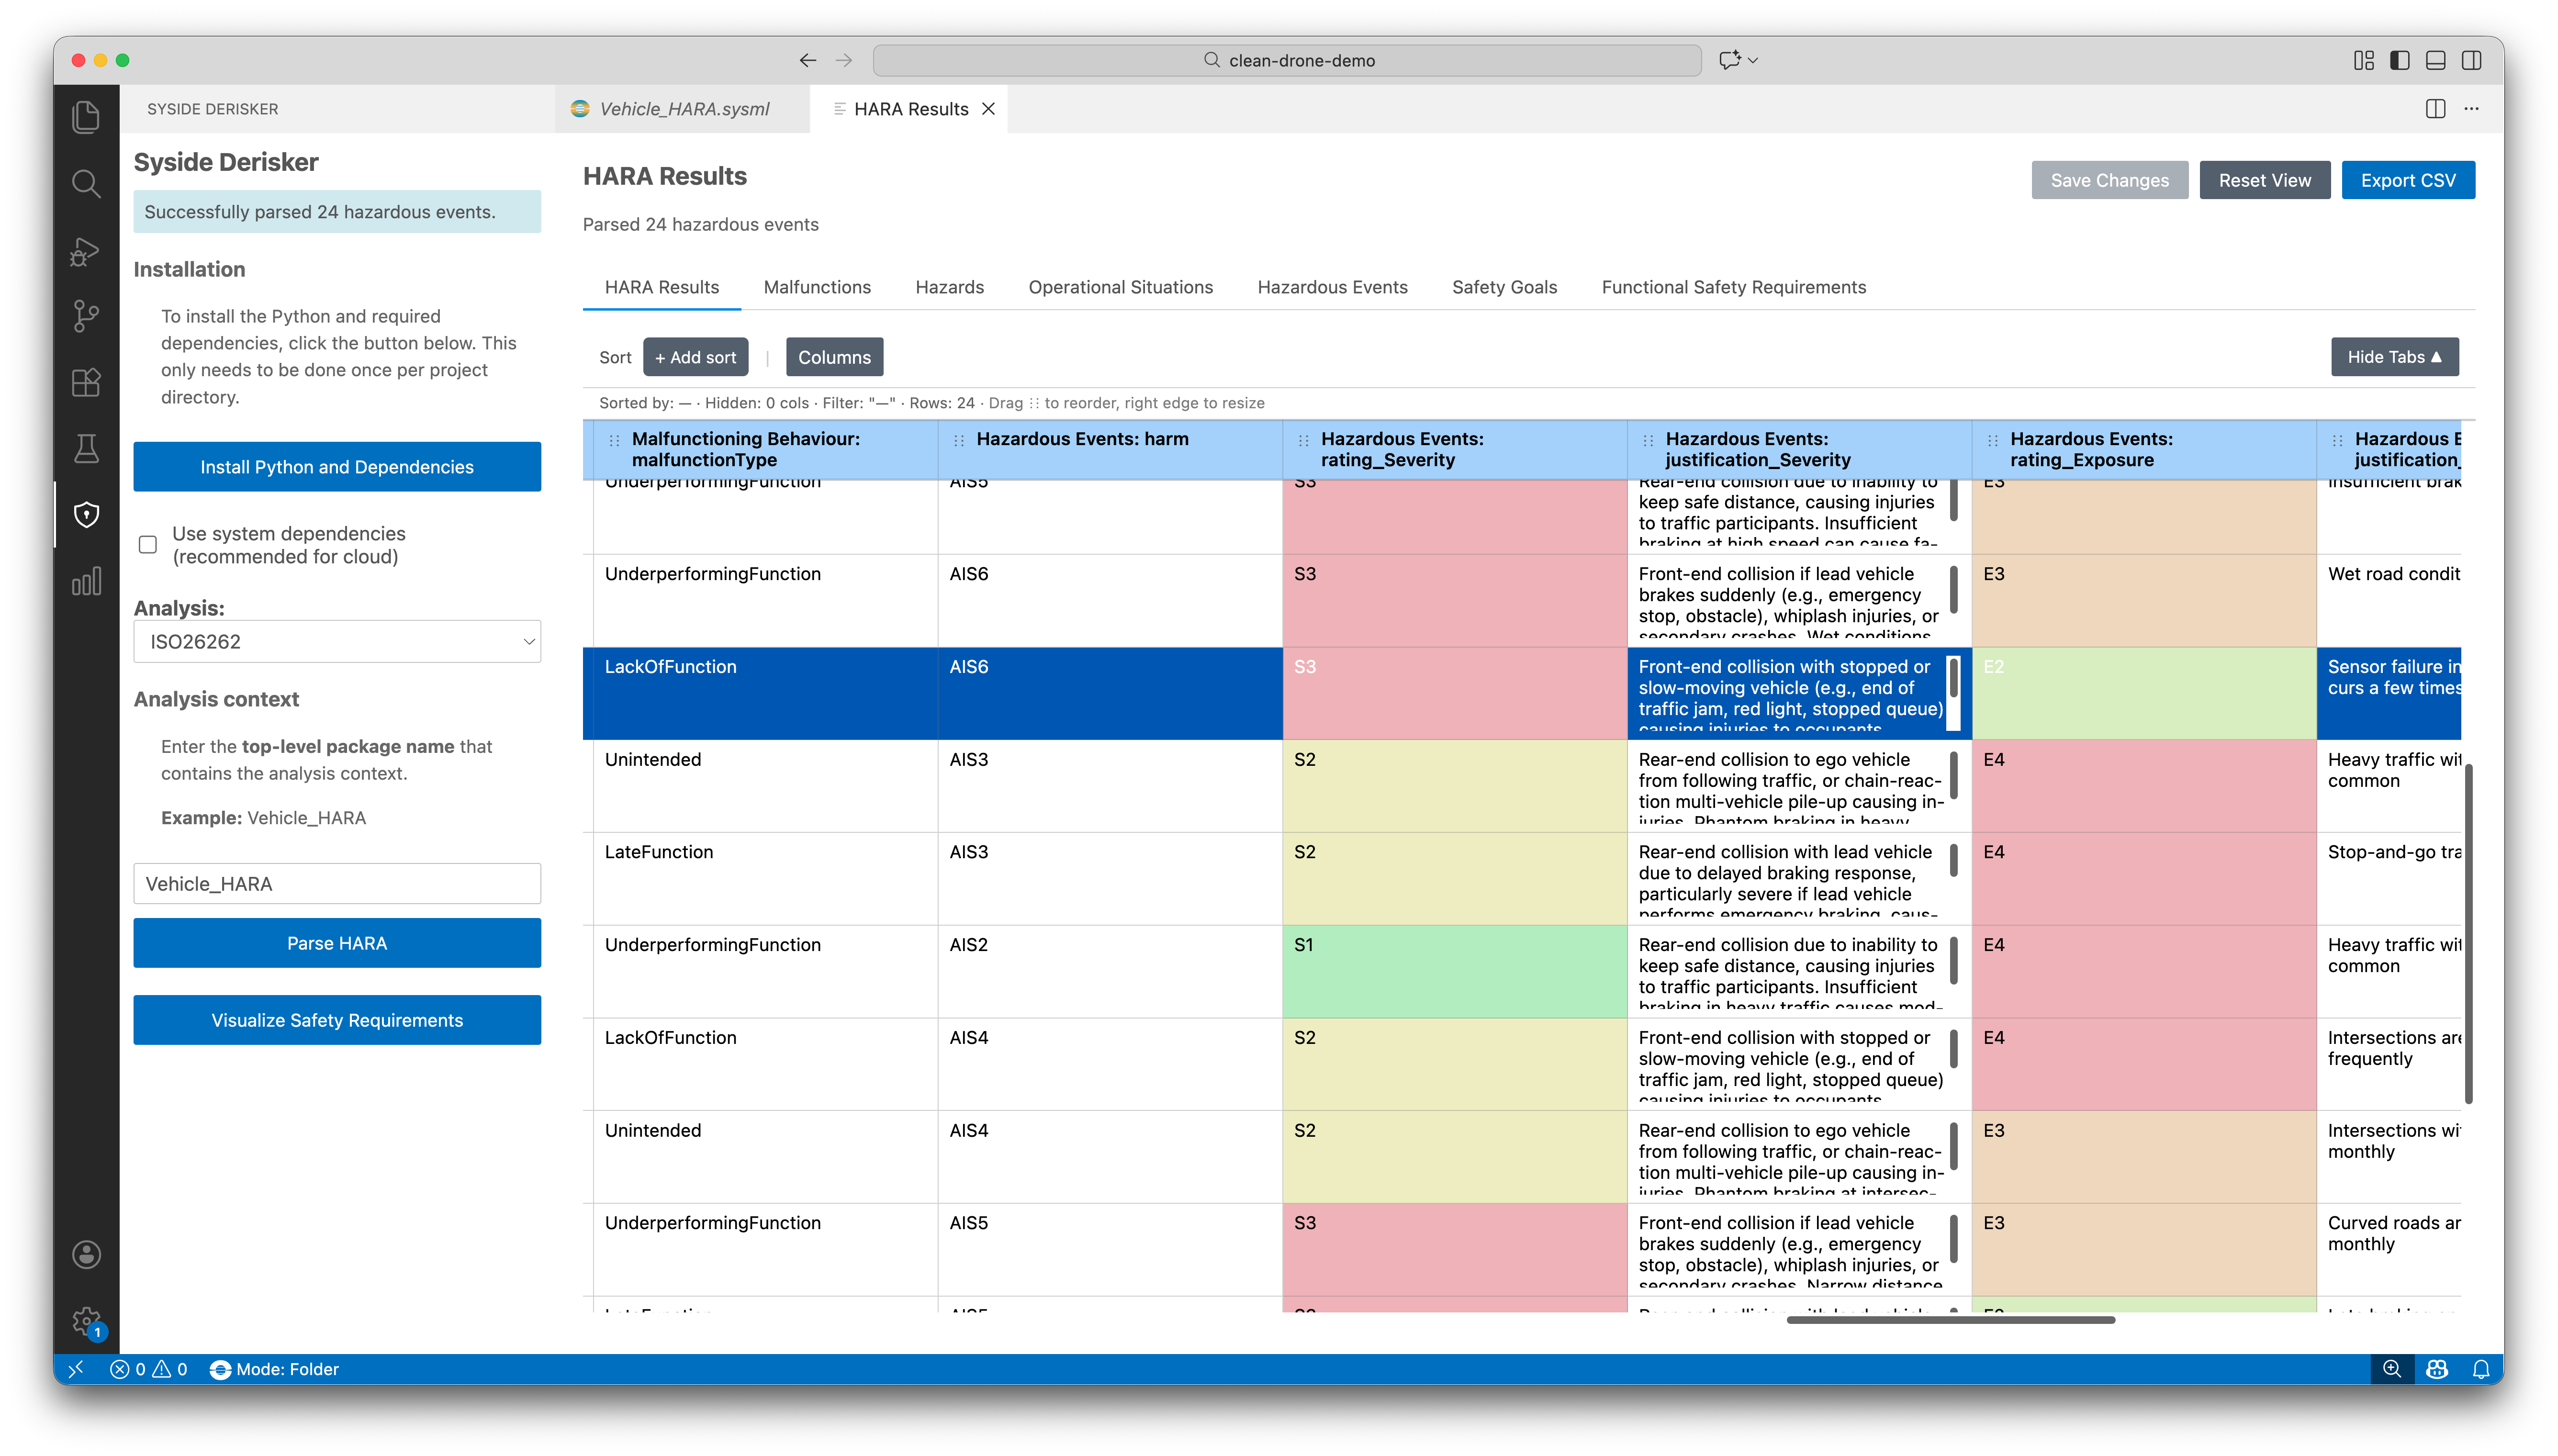
Work with table view
Table views provide a quick and easy way to review and edit analysis data without needing to write SysML v2 textual syntax. Editable cells range from free-text fields to drop-down menus. Changes are written back to the SysML v2 model automatically on save.
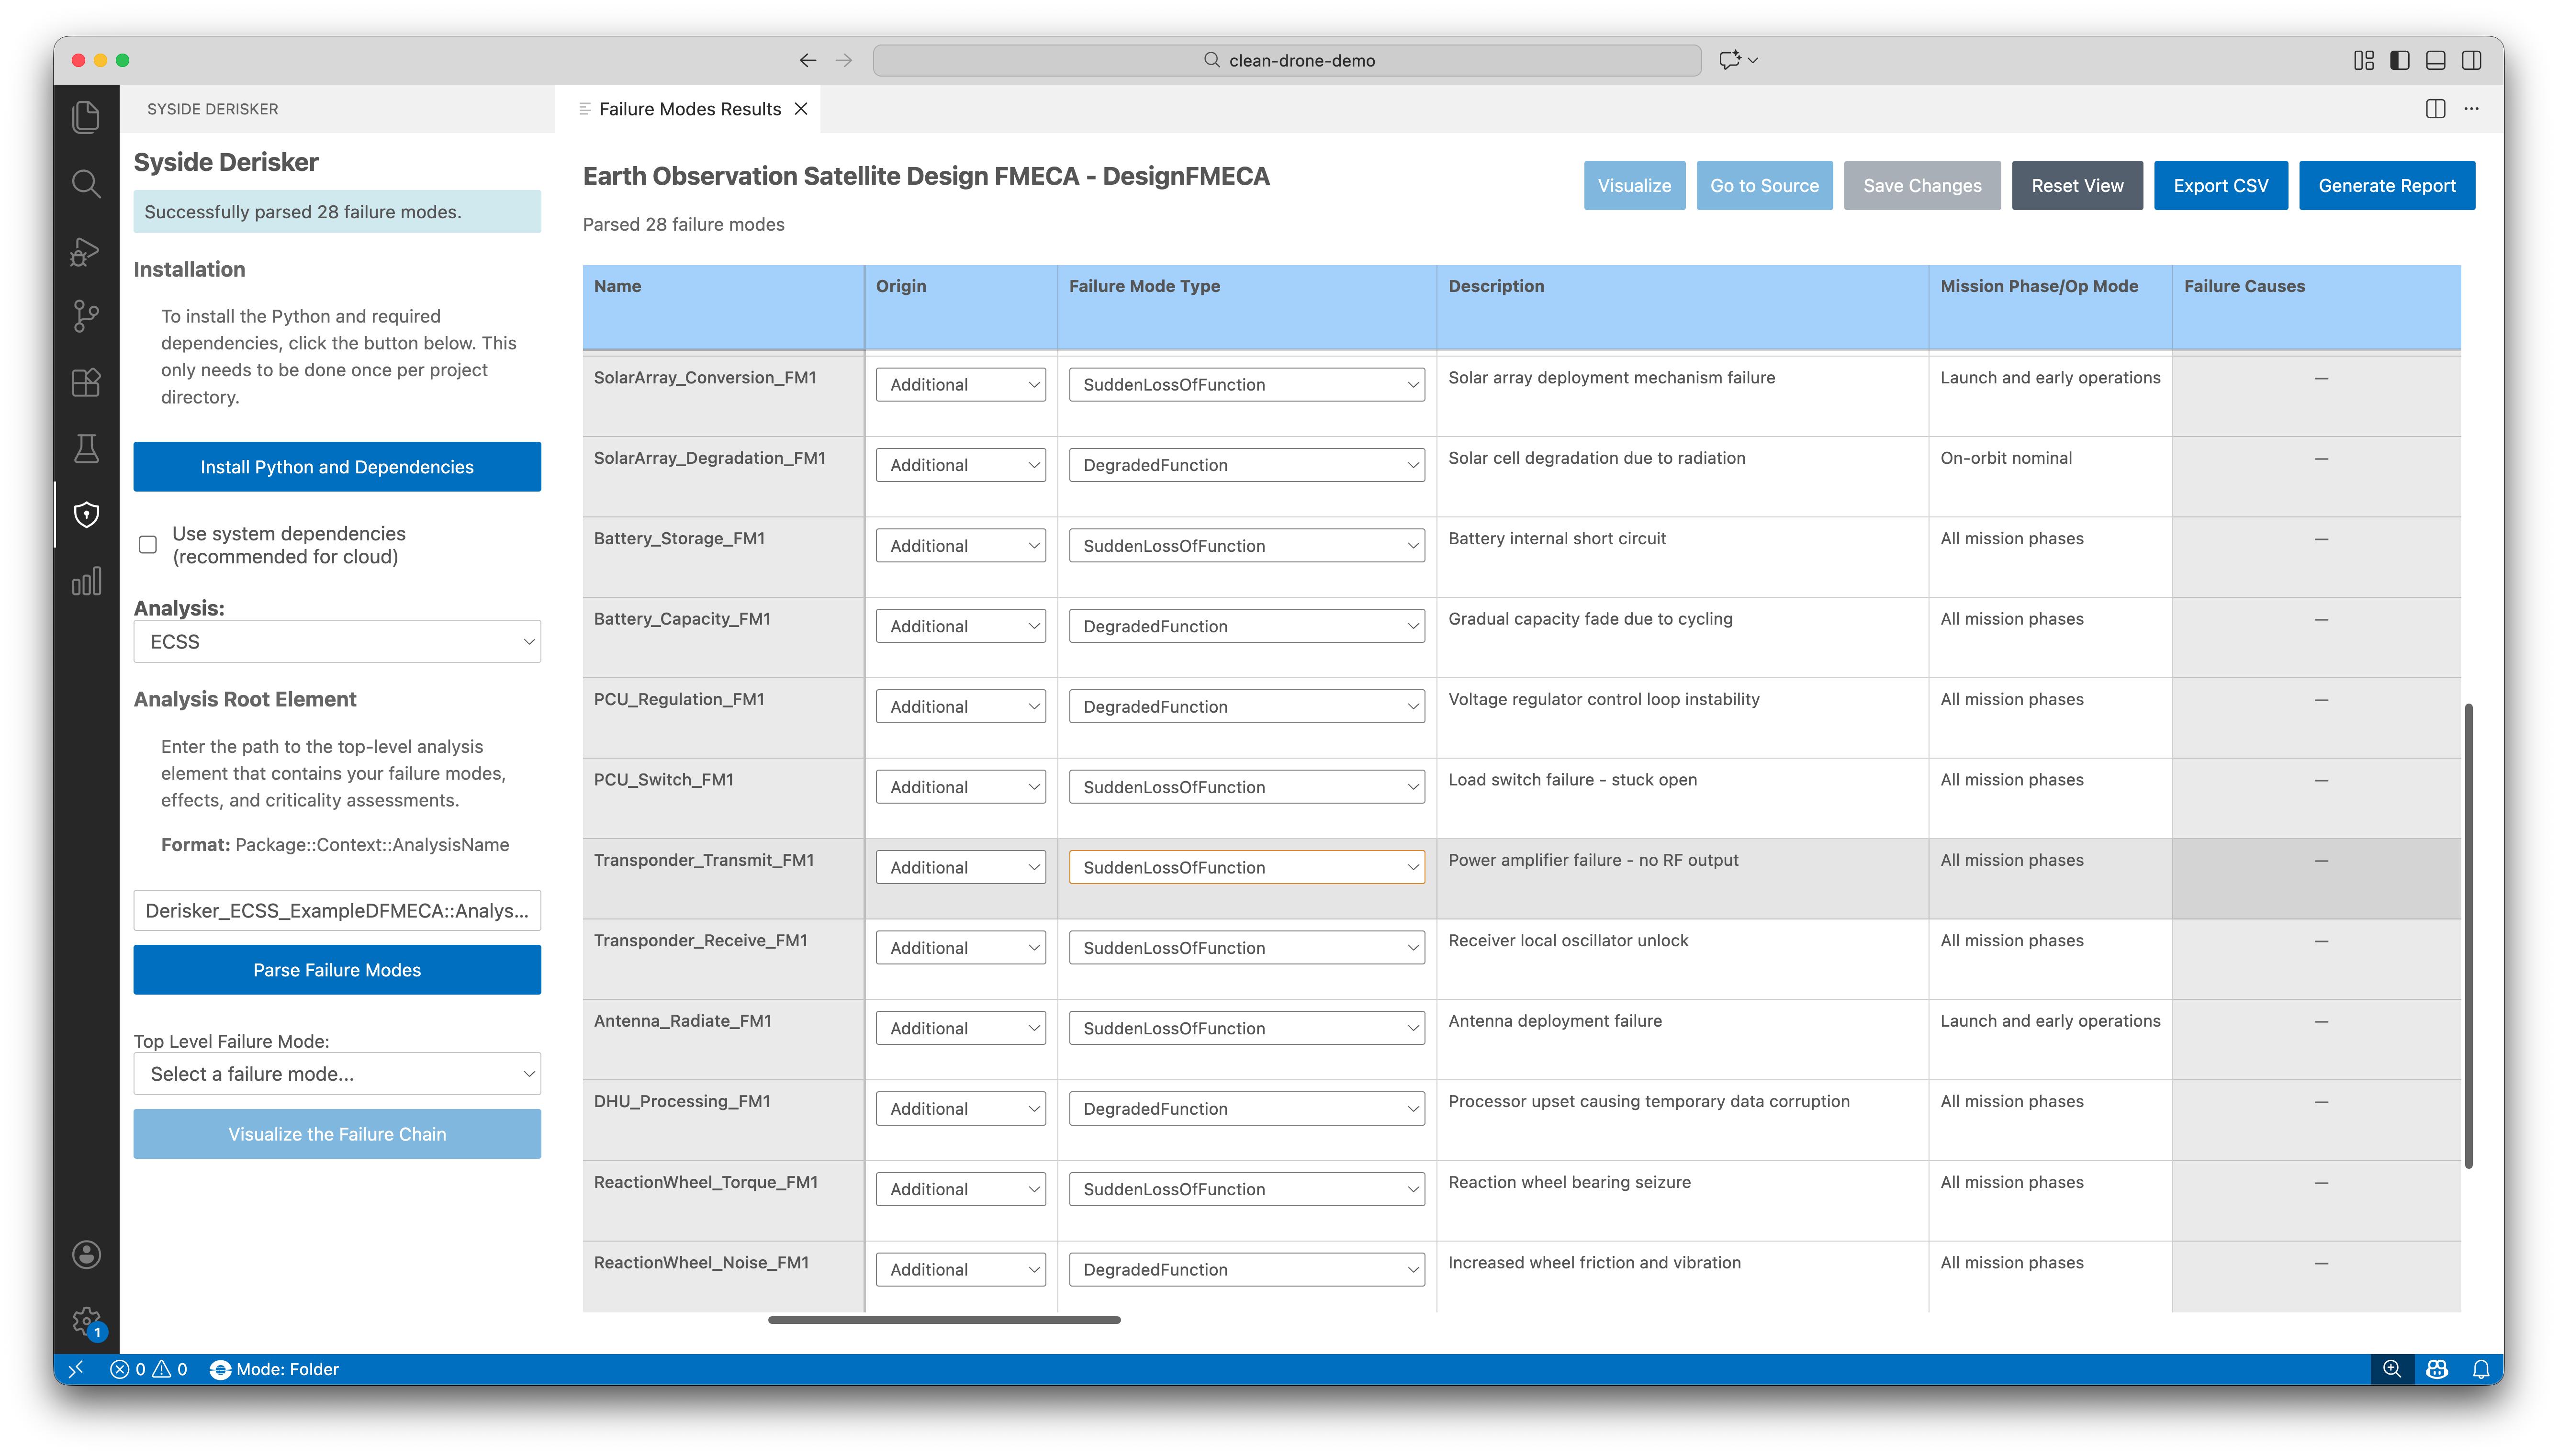
Table view capabilities:
Customize visible columns, sort by any field
Filter rows by attribute values
Color mapping on rated attributes for quick visual assessment
Add new elements directly from the table (ISO 26262)
Visualize relationships
Interactive graph diagrams show cause-effect relationships (failure chains) and safety goal hierarchies. Use diagrams to verify structural completeness and communicate results to stakeholders.
Pan, zoom, and reset view
Right-click nodes to go to source or jump to the corresponding table row
Export diagrams as PNG or JPEG
Export and reporting
Share and deliver analysis results in multiple formats:
CSV export — full table data with all columns, including computed values
Diagram export — PNG or JPEG at current zoom level
Report generation — HTML, PDF, and DOCX reports
Select a standard below for detailed feature documentation.