ISO 26262-3
Syside Derisker uses ISO 26262-3 library to support concept phase development of the road vehicles. It includes Hazard Analysis & Risk Assessment (HARA) and Functional Safety Concept.
Parse and Analyze HARA Items
Derisker extracts elements of HARA analysis from your SysML v2 model and automatically computes derived values like ASIL ratings. This eliminates manual calculations and ensures consistency across your analysis.
How to Parse
Open Derisker panel (click in left sidebar)
Enter the top level package name of your HARA model, e.g.
Derisker_ISO26262-3_ExampleHARA
Click Parse HARA
The parser automatically checks for any missing or incomplete elements of the HARA analysis and displays the items in editable table views.
Resulting Table Views
After a successful parse, the following table views are displayed:
HARA Results: A read-only table of the results of the HARA analysis. It displays all the elements of a specific hazardous event as well as its associated safety goal and safe states.
Malfunctions: An editable table view of the Malfunctioning Behaviours of the HARA analysis.
Hazards: An editable table view of the Hazards of the HARA analysis.
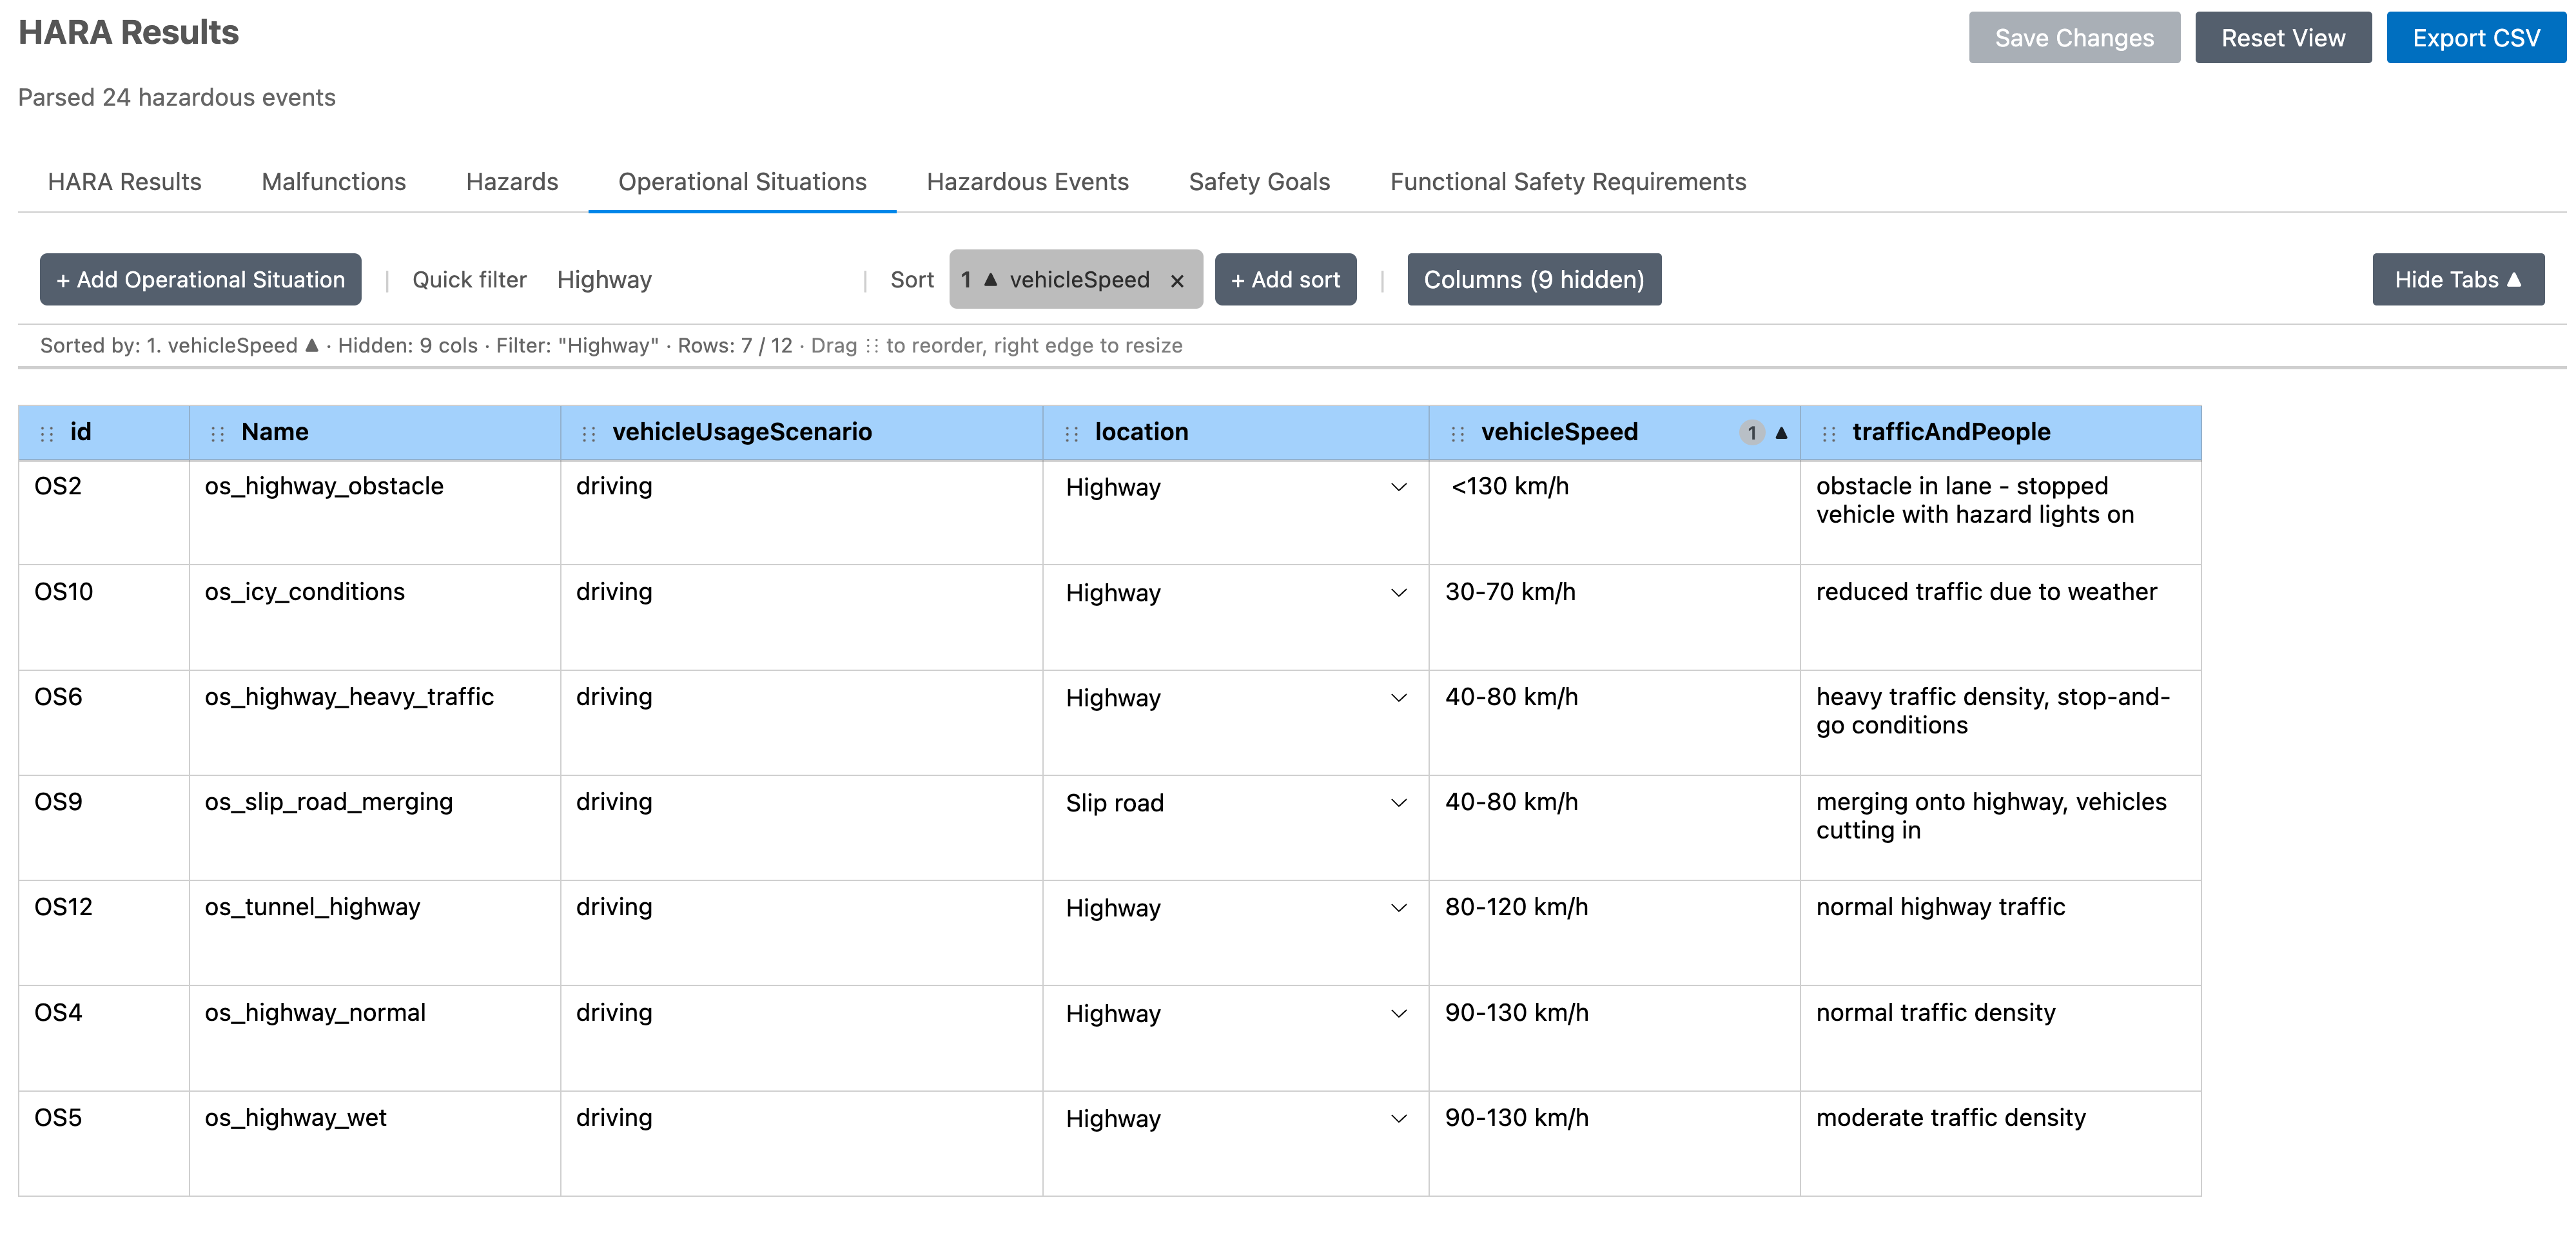
Operational Situations: An editable table view of the Operational Situations of the HARA analysis.
Hazardous Events: An editable table view of the hazardous events of the HARA analysis, automatically computing the resulting ASIL rating for each Hazardous Event.
Safety Goals: An editable table view of the Safety Goals of the HARA analysis, automatically computing the resulting ASIL rating based off of the associated Hazardous Events.
Functional Safety Requirements: An editable table view of the Functional Safety Requirements as well as any Functional Safety Subrequirements.
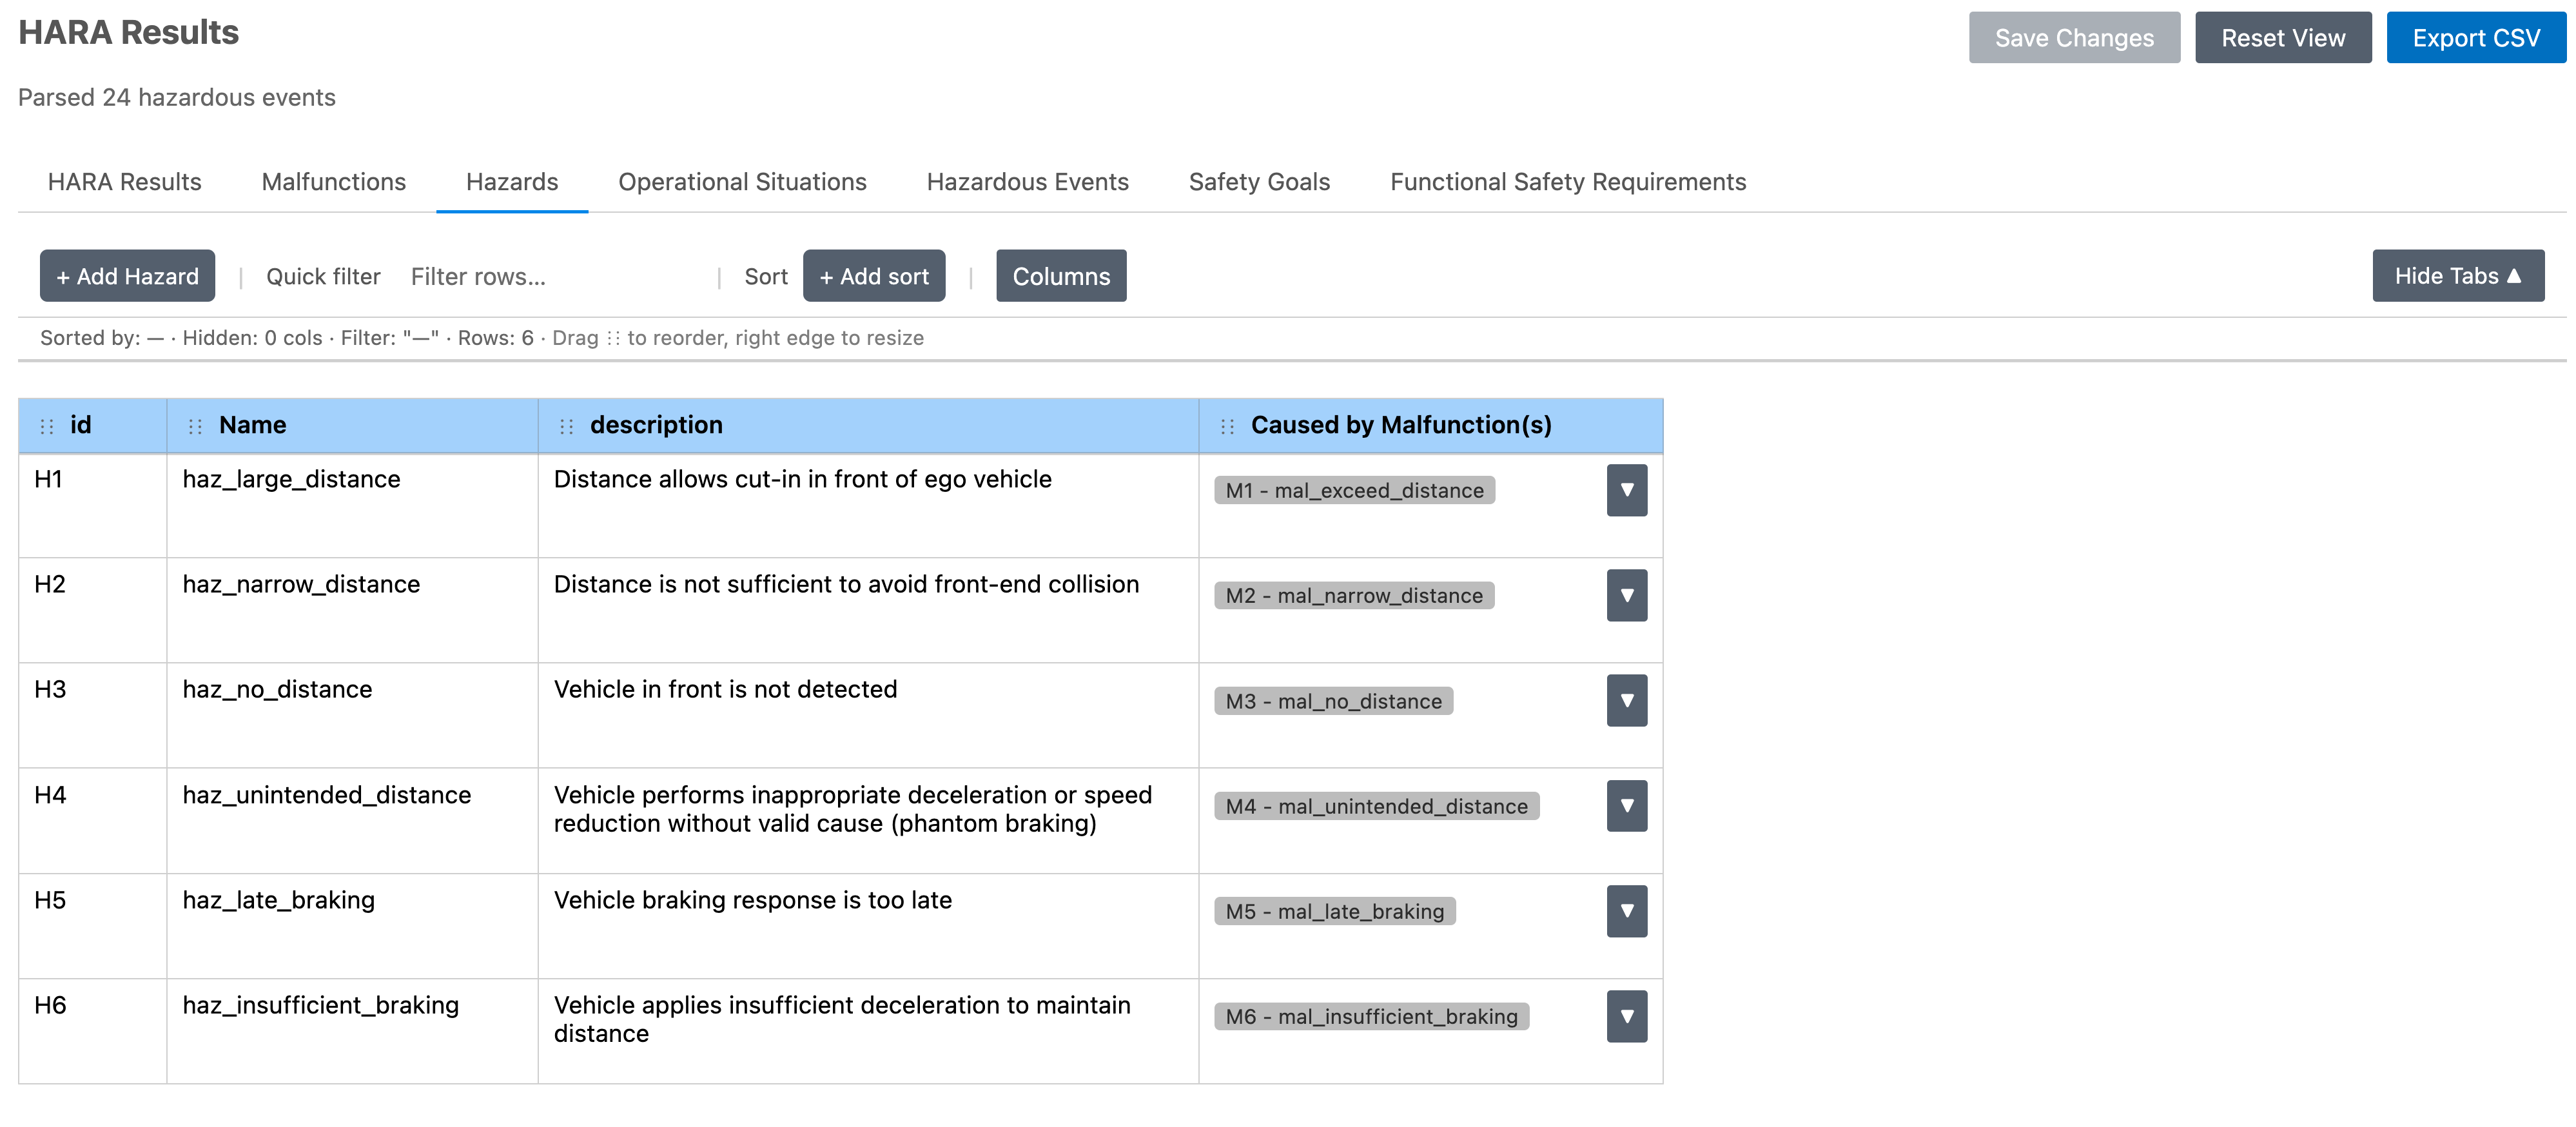
Attributes with associated values have a color map applied to them to help visualize the values.
Automatic Computations
Derisker computes derived values automatically:
ASIL (Hazardous Events): Resulting ASIL rating for each Hazardous Event
ASIL (Safety Goals): Resulting ASIL rating for each Safety Goal based on associated Hazardous Events
Work with Table Views
Review and edit HARA items in interactive tables with bidirectional synchronization to
your SysML model. The HARA Results table is read-only (it is a computed result, not
a single SysML element). The other table views are fully editable and allow new element
creation; the SysML model is the source of truth. Attributes that are calculated
automatically (such as rating_ASIL) are not editable.
Table Features
View and organize: Customize columns, sort by any field, select rows for navigation
Hide columns: Hide or show columns to tailor the view to your needs
Filter elements: Filter the table to only show elements that match a specific criteria
Edit properties: Editable cells range from text fields to drop-down menus; click Save Changes to write edits to the SysML model (validation runs automatically and errors are shown if invalid)
Navigate to source: Click
Go to Sourcein the right-click context menu to jump to the definition of the element in your SysML fileVisualize Safety Goal Relationships: In HARA Results, use Visualize Safety Goal Relationships to visualize Safety Goals and Functional Safety Requirements relationships
Export CSV: Export the HARA Results table view to a CSV file
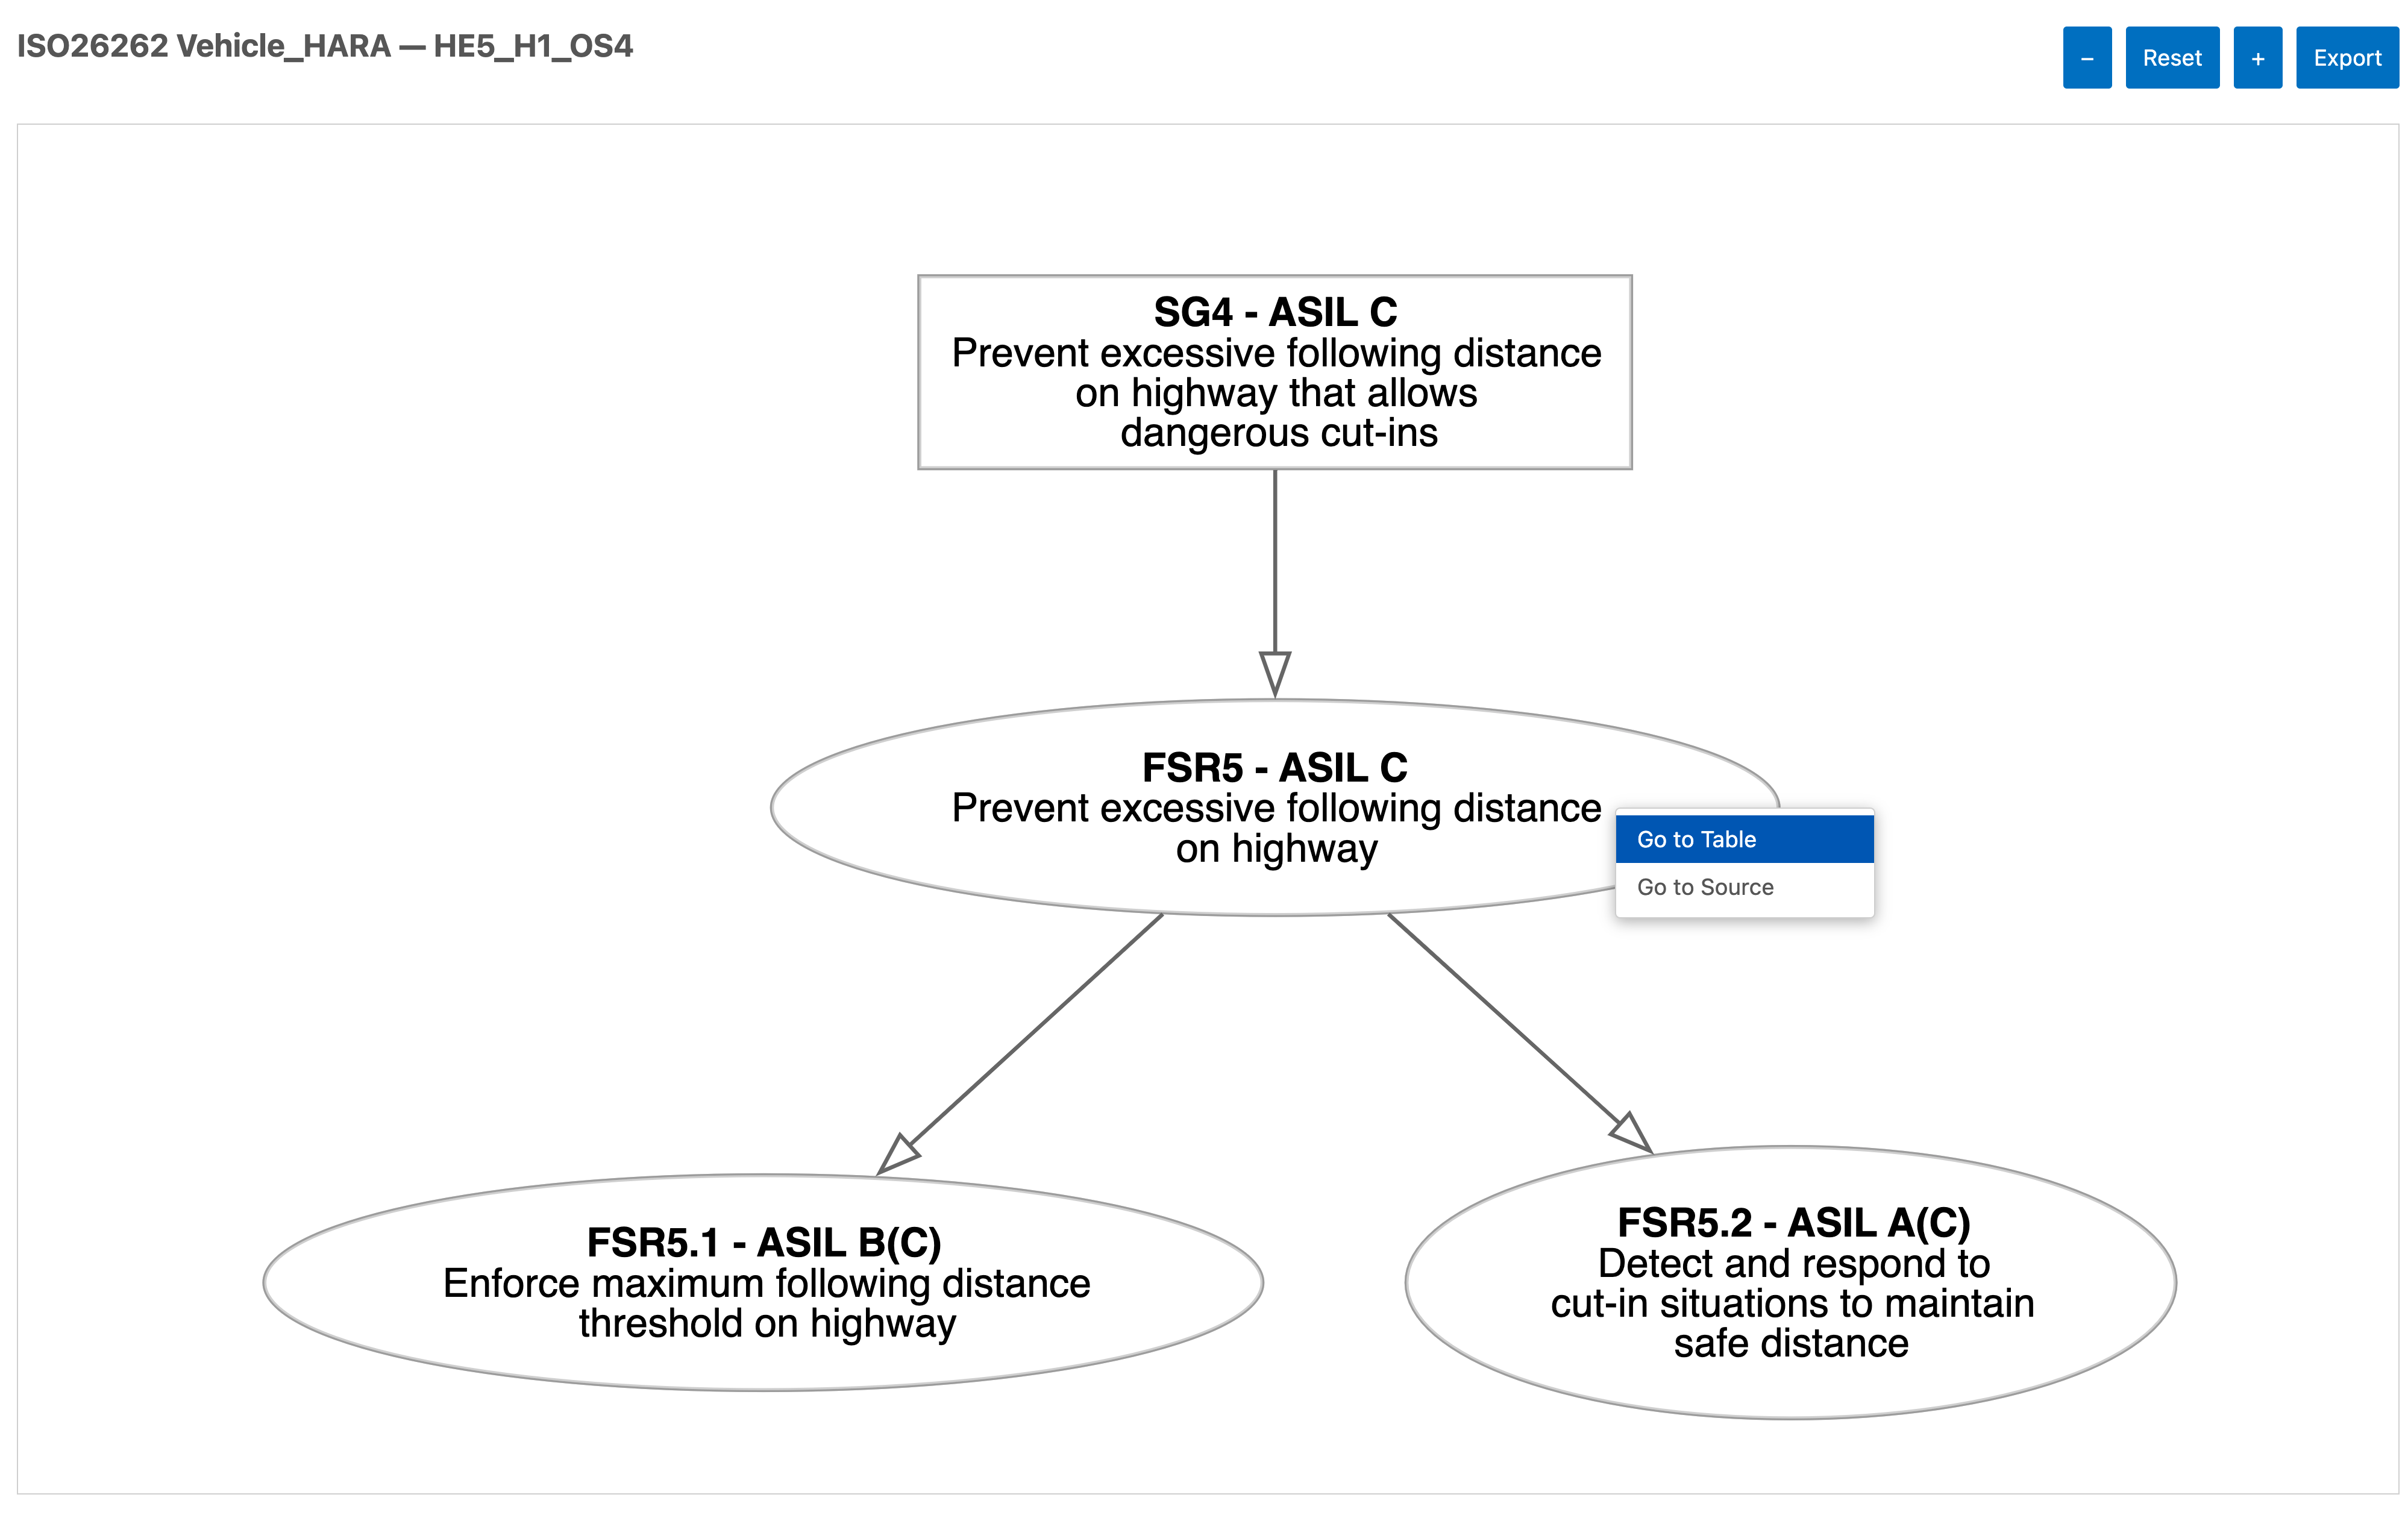
Visualize Safety Goals
Understand relationships between Safety Goals and Functional Safety Requirements with an interactive graph visualization.
How to Visualize
From the HARA Results table (one Hazardous Event):
In the HARA Results table view, select or focus a row for a specific Hazardous Event
Click
Visualize Safety Goal Relationshipsfrom the context menu
From the sidebar (all relationships):
Click Visualize Safety Requirements in the sidebar (available after HARA has been parsed)
Graph opens showing all Safety Goals and Functional Safety Requirements relationships
Interact with the graph:
Navigate: Pan and zoom as needed
Explore nodes: Right-click any node for Go to Source (jump to element in SysML) or Go to Table View (jump to the table view row for that element)
Export: Click Export in the top right corner to save the graph as PNG or JPEG
Export Results
Share analysis results by exporting data or visualizations.
How to Export
Export HARA Results to CSV:
In the HARA Results table view, use the export option to save to CSV
Choose save location and filename
Export graph to image:
In the Safety Goal / Safety Requirements graph view, click Export
Select format (PNG or JPEG) and save location
Image captures current graph layout and zoom level