ECSS-Q-ST-30-02C
Syside Derisker performs safety and reliability analysis using the ECSS-Q-ST-30-02C library.
Parse and Analyze Failure Modes
Derisker extracts failure modes from your SysML v2 model and automatically computes derived values like severity, probability, and criticality ratings. This eliminates manual calculations and ensures consistency across your analysis.
Supported Analysis Types
Derisker supports three analysis types:
Design FMEA: Failure Mode and Effects Analysis for design-phase analysis
Design FMECA: Design FMECA with probability ratings and criticality calculation
Process FMECA: Process FMECA with detection considerations
How to Parse
Open Derisker panel (click in left sidebar)
Enter analysis root element qualified namem e.g.
Derisker_ECSS_ExampleDFMECA::AnalysisContext::analysisProject
Click Parse Failure Modes
The parser validates your SysML model for syntax errors and detects cycles in failure mode chains. A table view of Failure Mode results opens automatically.
What Gets Extracted
The parser extracts standard-defined properties from each failure mode, grouped by category.
Category |
Properties |
|---|---|
Identification |
Name, origin, failure mode type, focus item and function |
Ratings |
Severity, probability (if applicable), detection (if applicable) and criticality |
Relationships |
Failure causes and effects, physical architecture location |
Analysis Details |
Observable symptoms and detection methods, recommendations and remarks, mission phase and operational mode applicability |
Automatic Computations
Derisker computes derived values automatically:
Severity |
Propagates top-down from effects (higher-severity effects flow to their causes) |
Probability |
Propagates bottom-up from causes (higher probabilities flow upward to effects) if applicable |
Detection |
Propagates bottom-up from causes (higher detection ratings flow upward to effects) if applicable |
Criticality |
Computed using relevant formulas for each analysis type, as specified in the ECSS-Q-ST-30-02C standard |
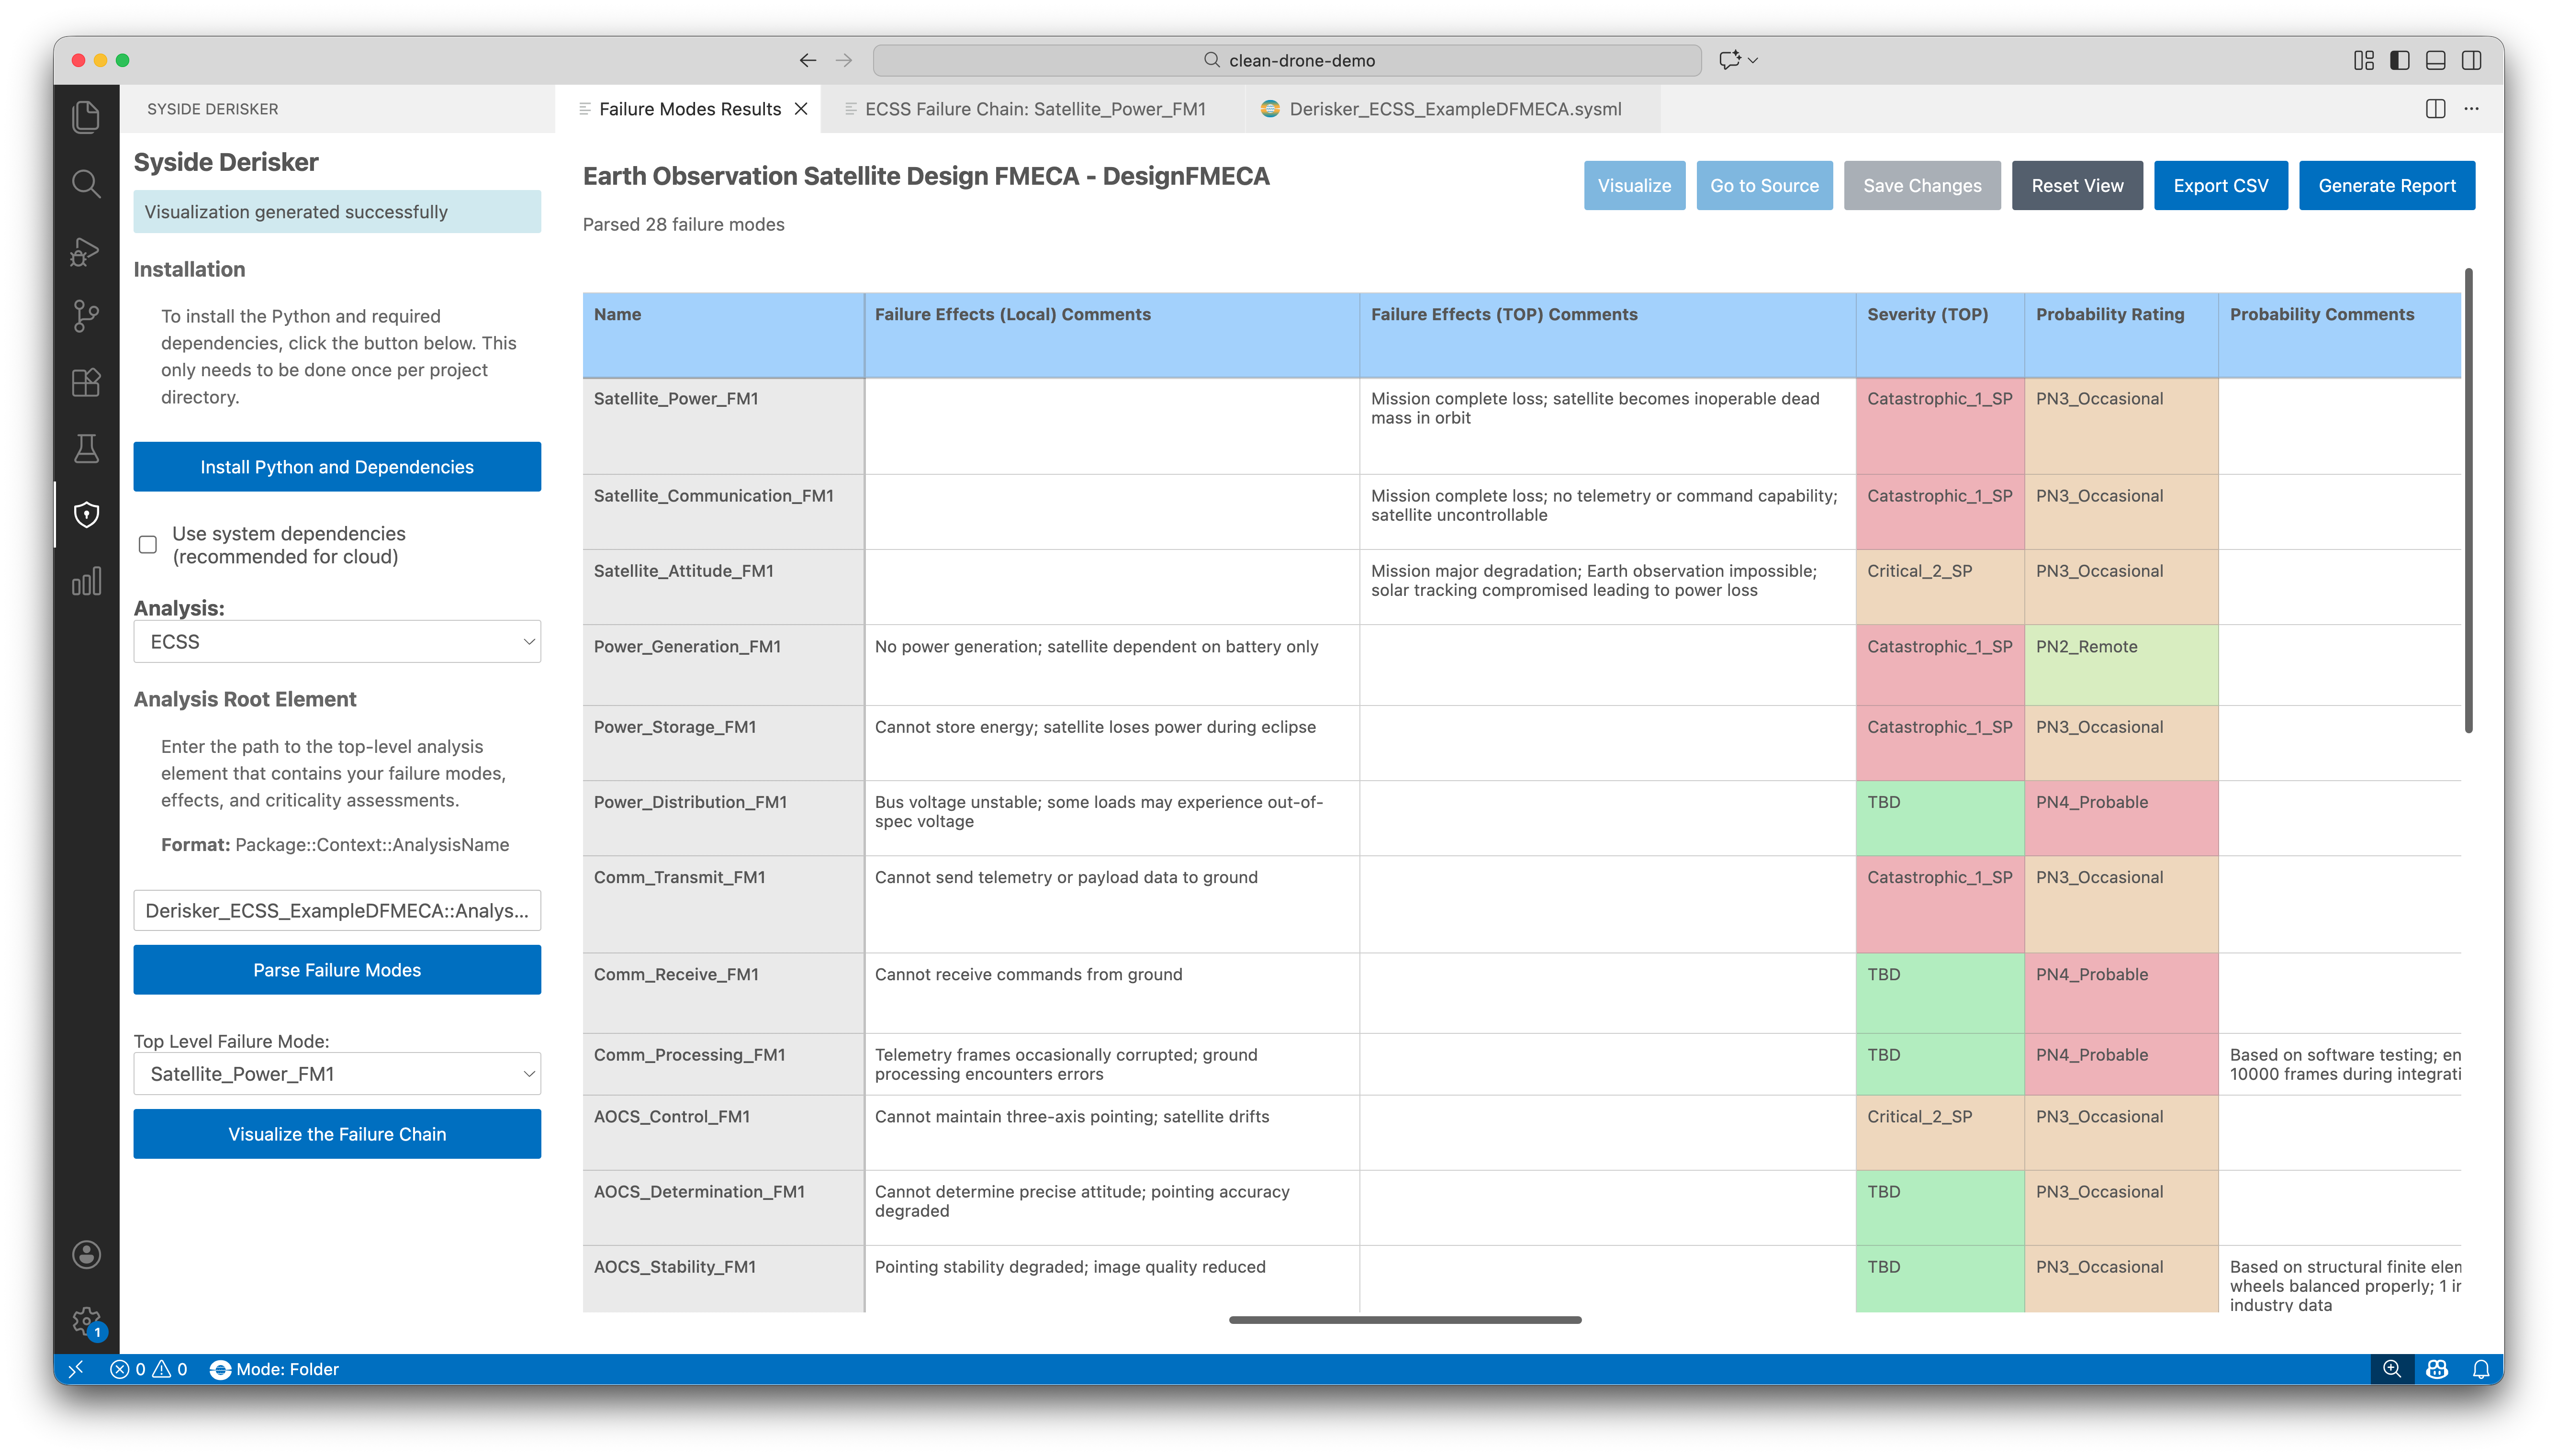
Work with Table View
Review and edit failure mode data in an interactive table with bidirectional synchronization to your SysML model.
Table Features
View and organize: Customize columns, sort by any field, select rows for navigation
Edit properties: Modify text and enum fields (dropdowns)
Navigate to source: Click Go to Source to jump to the failure mode definition in your SysML file
Save changes: Click Save Changes to write edits back to your model
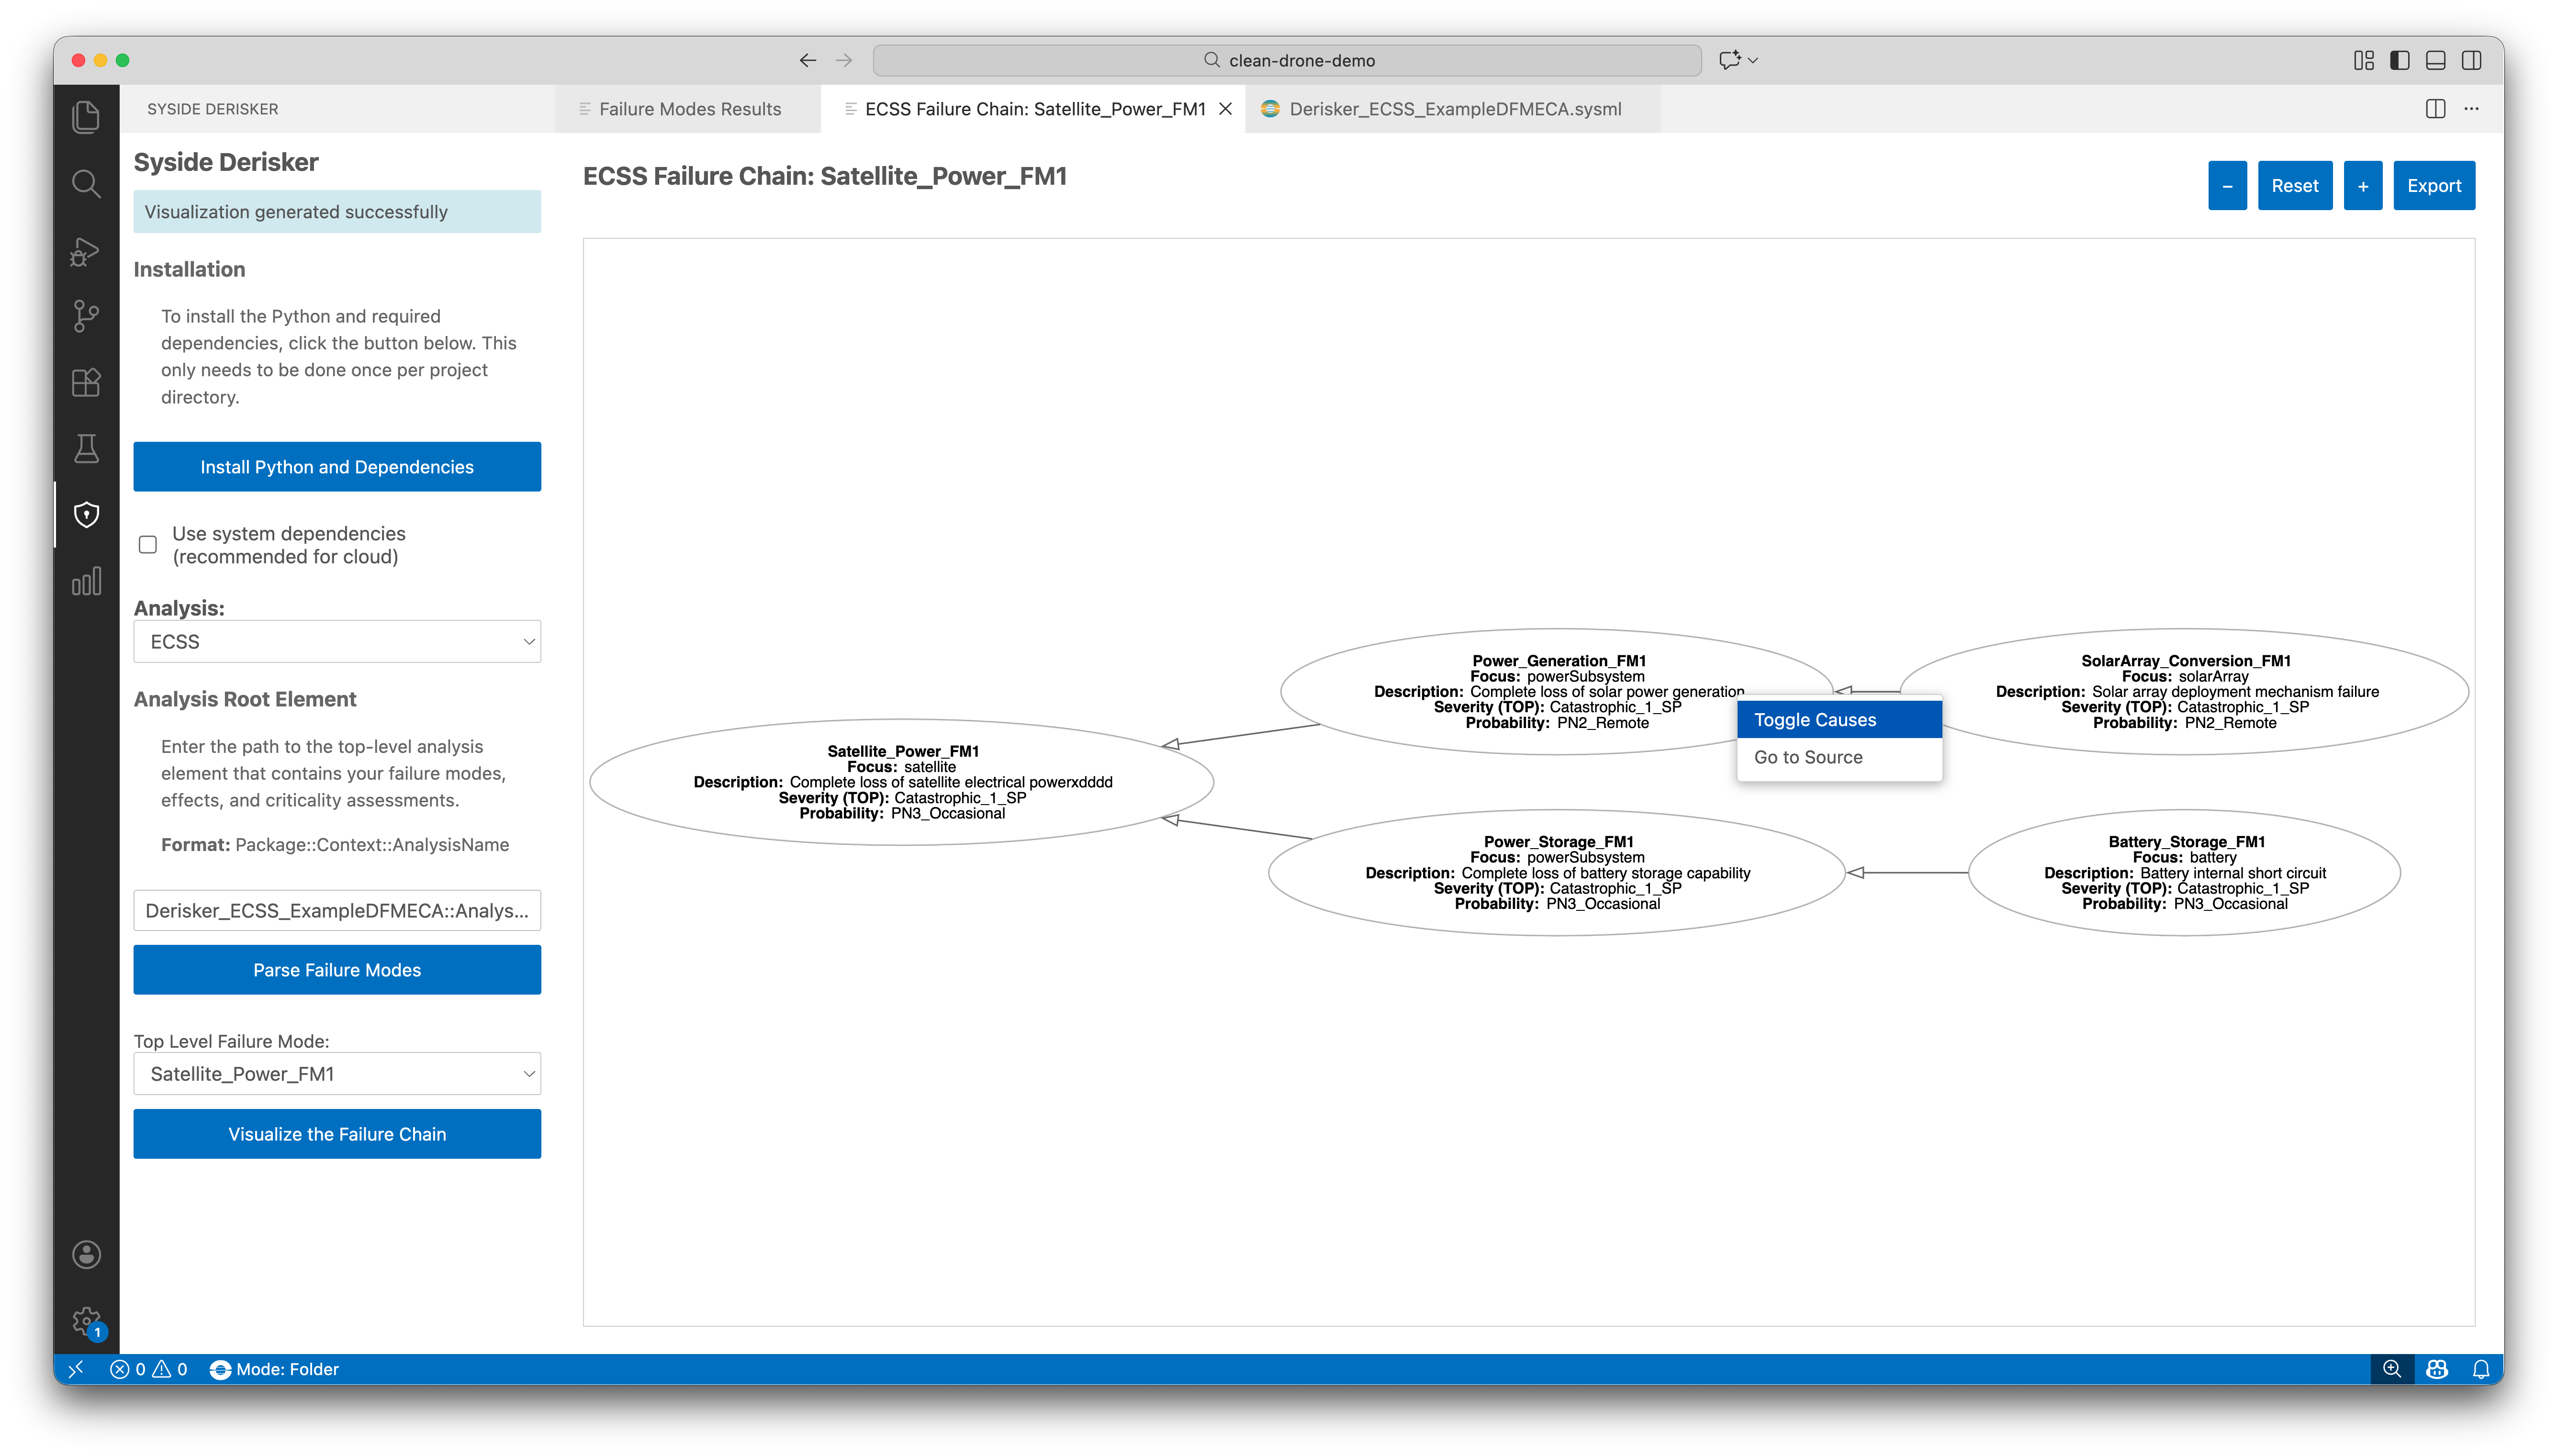
Visualize Failure Chains
Understand how failures propagate through your system with interactive graph visualizations showing cause-effect relationships for any failure mode.
How to Visualize
In table view, select a failure mode row
Click Visualize Failure Chain
Graph opens in new panel showing the failure mode and its relationships
Interact with the graph:
Navigate: Pan (click and drag), zoom (+/- buttons), reset view
Explore nodes: Right-click any node to toggle causes or go to source
Note
Graphviz must be installed. See Install Graphviz for installation instructions.
Export Results
Share analysis results by exporting data or visualizations.
How to Export
Export table to CSV:
Click Export to CSV in table view
Choose save location and filename
File contains all failure modes with column headers. Array fields (causes, effects) are comma-separated.
Export graph to image:
Click Export in failure chain view
Select format (PNG or JPEG) and save location
Image captures current graph layout and zoom level
Note
Exported CSV is generated based off of the SysML model at the time of export. Any unsaved changes in the tableview will not be included in the exported CSV.
Tip
Export CSV before saving changes to preserve your original analysis state for comparison.